Outdoor News Bulletin
Excise Tax Snapshot
The Wildlife Management Institute (supported by a Multi-State Conservation Grant) provides you with this quarterly snapshot of the excise tax collections to help you understand the health of the American System of Conservation Funding. This system, which was established in the 1930s and expanded and perfected over the next 40+ years, provides a reliable source of annual funding for state fish and wildlife agencies through a unique partnership between the agencies and the hunting, shooting sports, angling, and boating industries. In rough numbers, these excise tax deposits made by the partner industries represent about half of the state fish and wildlife agencies’ annual budgets. Therefore, it is imperative to conservation that agencies (from the commissioners down to the field biologists) understand the industry trends and work with these industries to ensure a strong income flow going forward.
The following numbers cover the first three quarters of the 2020 federal fiscal year (October 1, 2019 thru June 30, 2020) and compares them to the same period in fiscal year 2019. This information is provided by the U.S. Fish and Wildlife Service who gets the data directly from the two collection agencies (the Internal Revenue Service and the Tax and Trade Bureau).
As you review these numbers, one point to keep in mind is the COVID-19 related impacts we are experiencing. The information below covers the collections through the first three quarters of the fiscal year (through June) and we all know that the impacts of this pandemic continue, and we are not sure how long we will see the ripple effects. In fact, the numbers you are about to view look bad – really bad. However, if there is a silver lining, it is likely that most of these “bad” numbers are the result of extensions the Administration provided to business for filing and paying their excise taxes. So, the taxes are still due, we are just seeing a lag in collections. Hopefully, in the coming quarters we will see these numbers rebound.
The collections for the Sport Fish Restoration Account only dropped 4% from the 2019 collections. While you might say this looks fairly good overall, a closer look at the numbers shows that the actual collections related to fishing took a serious hit. The big collection areas (fuel taxes) remained stable since that area was not impacted by filing and payment extensions. Frankly, this is surprising in that some speculated that fuel tax collections would drop as the public restricted their travel. If there is a bright side, it is with interest earnings, which were up 38%. This is likely due to state agencies lagging in requesting payments – due to COVID related delays in the agencies. Hopefully, we will see these numbers begin to increase as businesses get back on their normal filing and payment schedules.
Following is a closer look at the numbers.
The Sport Fish Restoration Account
The Trends:
Here are the comparisons of the collections for the first three quarters of FY 2019 and FY 2020.
table, th, td {
border: 1px solid #333;
border-collapse: collapse;
}
td {
padding: 5px;
}
| Trends Between Last and Current Fiscal Years | |||
| Product | FY 2019 (thru Qtr 3) | FY 2020 (thru Qtr 3) | % Change |
| Motorboat Fuel Tax | $201,801,000 | $200,521,000 | -1% |
| Small Engine Fuel Tax | $87,131,000 | $87,511,000 | 0% |
| Interest | $19,541,606 | $26,970,439 | 38% |
| Customs Duties | $48,027,721 | $39,827,754 | -17% |
| Fishing Equipment | $76,017,566 | $68,676,121 | -10% |
| Electronic Boat Motors | $4,604,997 | $3,916,875 | -15% |
| Fishing Tackle Boxes | $729,414 | $554,025 | -24% |
| Fishing Rods and Poles | $20,552,438 | $13,276,261 | -35% |
| Total Sportfish & Boating Restoration | $458,405,742 | $441,253,475 | -4% |
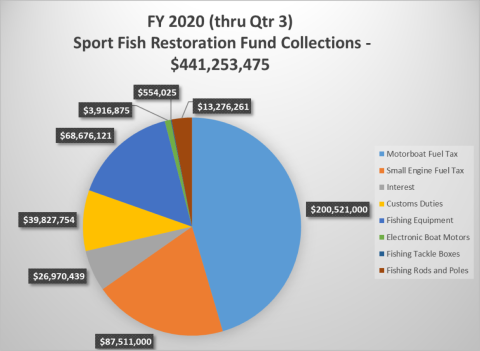
The Funding Sources:
It is important to understand where these numbers come from, how they relate to past numbers and how the individual funding sources relate to the overall funding available. The following pie-chart provides a strong reference of the importance of funding sources that are not directly related to fishing equipment (motorboat and small engine fuel taxes; customs duties; interest) are to the support of state agencies’ aquatic conservation efforts (80.4% of the total funding).
Wildlife Restoration Account
The Trends:
Here are the comparisons of the collections for the first three quarters of FY 2019 and FY 2020.
| Trends Between Last and Current Fiscal Years | |||
| Product | FY 2019 (thru Qtr 3) | FY 2020 (Qtr 3) | % Change |
| Pistols & Revolvers | $144,376,476 | $113,033,276 | -22% |
| Firearms | $144,785,724 | $107,240,259 | -26% |
| Shells & Cartridges | $139,379,368 | $117,863,736 | -15% |
| Archery Equipment | $31,091,259 | $20,354,902 | -35% |
| Arrow Shafts | $5,936,902 | $4,883,963 | -18% |
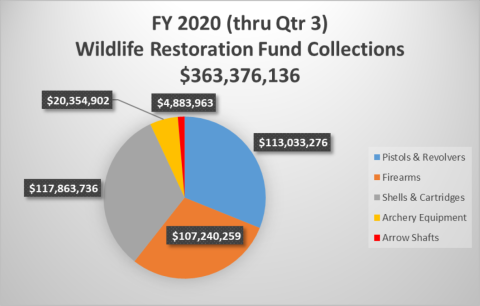
| Total Wildlife Restoration | $465,569,729 | $363,376,136 | -22% |
The Funding Sources:
An important piece of information that we must not overlook in this collection data is the source of the funds. Roughly speaking, less than 10% of the collections are coming from archery and around 30% each is coming from pistols, firearms, and ammunition. It is also interesting to note that pistols and ammunition are the biggest contributors – a strong message of support for recreational shooting ranges! Here is a pie chart that shows this a bit more dramatically:
Summary:
While these numbers look bad in both accounts, there is no reason to doubt a rebound is on the way. The effects of COVID have hit us all, but there is no indication that the public is turning away from angling, boating, and hunting. In fact, all indications are that we are in a good place. We just need to wait for the collections to catch up.
Stay strong and stay healthy.