Outdoor News Bulletin
Excise Tax Snapshot
The Wildlife Management Institute (supported by a Multi-State Conservation Grant) provides you with this quarterly snapshot of the excise tax collections to help you understand the health of American System of Conservation Funding. This system of funding was established in the 1930s and expanded and perfected over the next 40+ years. This reliable source of annual funding for state fish and wildlife agencies represents a unique partnership between the agencies and the hunting, shooting sports, angling, and boating industries. In rough numbers, these excise tax deposits made by the partner industries represent about half of the state fish and wildlife agencies’ annual budget. Therefore, it is imperative to conservation that agencies (from the Commissioners down to the field biologists) understand the industry trends and work with these industries to ensure a strong income flow going forward.
The following numbers cover the 2019 Federal fiscal year (October 1, 2018 thru September 30, 2019) and compare those numbers to the same period in fiscal year 2018.
The Sport Fish Restoration Account continued to hold up related to last year’s collections with a small 2% increase (up by just over $10 million). You may recall that we were up by about 9% at the midway point for FY 2019, so things have slipped a little over the last six months. The category of funding contribution to the Sport Fish Restoration Account with the strongest FY 2019 performance was general fishing equipment, which showed a $12 million increase over FY 2018 numbers.
The collections for the Wildlife Restoration Account during FY 2019 continue to slip from FY 2018 numbers – closing the year out with a 9% reduction (equating to a loss of roughly $58.5 in revenues to state wildlife agencies). Worse news than this is looking back just six months. At that point, these excise tax collections were down only 4%, so the slide in excise tax collections is increasing. There really isn’t a bright side of these numbers. Overall archery collection numbers were about even, but those numbers are less than 10% of the total collections into the Wildlife Restoration Account.
Following is a closer look at the numbers.
BTW – for those of you wondering, these number are provided by the Fish and Wildlife Service who get them directly from the two collection agencies (the Internal Revenue Service and the Tax and Trade Bureau)
The Sport Fish Restoration Account
The Trends:
Here are the comparisons of the collections for FY 2018 and FY 2019.
table, th, td {
border: 1px solid #333;
border-collapse: collapse;
}
td {
padding: 5px;
}
| Trends Between Last and Current Fiscal Years | |||
| Product | FY 2018 | FY 2019 | % Change |
| Motorboat Fuel Tax | $312,747,000 | $315,747,000 | 1% |
| Small Engine Fuel Tax | $123,007,000 | $123,007,000 | 0% |
| Interest | $24,175,214 | $23,168,942 | -4% |
| Customs Duties | $63,575,908 | $62,585,622 | -2% |
| Fishing Equipment | $93,269,516 | $105,251,517 | 13% |
| Electronic Boat Motors | $5,924,053 | $5,975,069 | 1% |
| Fishing Tackle Boxes | $1,693,480 | $1,923,066 | 14% |
| Fishing Rods and Poles | $24,965,721 | $22,102,708 | -11% |
| Total Sportfish & Boating Restoration | $649,357,892 | $659,760,924 | 2% |
The Funding Sources:
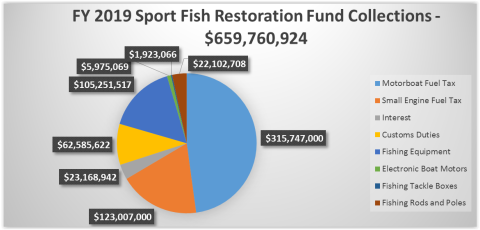
It is important to understand where these numbers come from, how they relate to past numbers and how the individual funding sources relate to the overall funding available. The following pie-chart shows how important funding sources that are not directly related to fishing equipment (motorboat and small engine fuel taxes; customs duties; interest) are to the support of state agencies' aquatic conservation efforts (79.5% of the total funding).
Wildlife Restoration Account
The Trends:
Here are the comparisons of the collections for FY 2018 and FY 2019.
| Trends Between Last and Current Fiscal Years | |||
| Product | FY 2018 | FY 2019 | % Change |
| Pistols & Revolvers | $201,966,531 | $190,292,572 | -6% |
| Firearms | $205,227,233 | $190,240,227 | -7% |
| Shells & Cartridges | $217,575,786 | $185,712,788 | -15% |
| Archery Equipment | $38,308,066 | $39,710,877 | 4% |
| Arrow Shafts | $9,756,882 | $8,326,061 | -15% |
| Total Wildlife Restoration | $672,834,498 | $614,282,525 | -9% |
The Funding Sources:
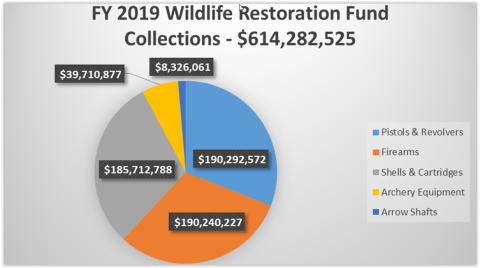
An important piece of information that we must not overlook in this collection data is the source of the funds. Roughly speaking, less than 10% of the collections are coming from archery and around 30% each is coming from pistols, firearms and ammunition. Here is a pie chart that shows this a bit more dramatically:
Summary:
There is not a lot of good in these numbers. Fishing numbers are barely holding their own and most of this is due to the relatively stable contributions related to motorboat and small engine fuels. The wildlife numbers are still sending a strong signal that this foundational program of the American System of Conservation Funding is not healthy and now we have seen this unhealthy signal persist for over a year. Restoring the health of the American System of Conservation Funding is of paramount importance to the state fish and wildlife agencies. We simply can’t afford to continue to lose $50+ million in annual revenues and maintain the high-quality fish and wildlife management that state agencies are known for. We can’t expect expanded hunting and fishing access when the agency most responsible for providing that access is seeing these kinds of funding cuts.
It is extremely important that we do all we can to generate more hunters and anglers and to make sure that the excise taxes are being applied fairly across the industries and being collected effectively.