Outdoor News Bulletin
Excise Tax Snapshot - First Two Quarters of FY2020
The Wildlife Management Institute (supported by a Multi-State Conservation Grant) provides this quarterly snapshot of the excise tax collections to help understand the health of American System of Conservation Funding. This system of funding was established in the 1930s and expanded and perfected over the next decades. This reliable source of annual funding for state fish and wildlife agencies represents a unique partnership between the agencies and the hunting, shooting sports, angling, and boating industries. In rough numbers, these excise tax deposits made by the partner industries represent about half of the state fish and wildlife agencies’ annual budget. Therefore, it is imperative to conservation that agencies (from the commissioners down to the field biologists) understand the industry trends and work with these industries to ensure a strong income flow going forward.
The following numbers cover the first half of the 2020 federal fiscal year (October 1, 2019 thru March 31, 2020) and compare those numbers to the same period in fiscal year 2019. These numbers are provided by the U.S. Fish and Wildlife Service, which gets them directly from the two collection agencies (the Internal Revenue Service and the Tax and Trade Bureau).
As you review these numbers, one point to keep in mind is the COVID-19 related impacts we are experiencing. These number cover the collections thru the first two quarters of the fiscal year (thru March) and we all know that the impacts of this pandemic will last well into the third and possibly the fourth quarters of this fiscal year.
Excise tax contributions for the Sport Fish Restoration Account appeared to be on a fairly solid increasing trajectory for the first five months and then we saw a significant drop in the March collections. The March numbers ate up the gains of the first five months – and then some. Collections for the Sport Fish Restoration Account are down by 3 percent over the 2019 numbers (roughly $7.5 million). While this doesn’t look too bad on the surface, a deeper dive into the details gives us a bigger reason for concern. As you can see from the chart below, the reductions in the current numbers came from lower collections on fishing equipment and custom duties. The chart also shows that the gasoline related tax collections held steady through March. As we all know, the gas tax is by far the largest contributor to the Sport Fish Restoration Account and the reductions in travel related to the COVID-19 stay at home orders are likely to adversely impact these numbers in the collections for the coming months. The numbers we see over the next month or two may be significantly lower and cause the Sport Fish Restoration numbers to drop.
If there is a silver lining to the COVID-19 related issues, it is with the Wildlife Restoration Account. As you recall, we have seen significant drops in contributions into the Wildlife Restoration Account over the last two fiscal years (2018 and 2019). The first half of the 2020 federal fiscal year (October thru March) has shown a rebound of collections over the 2019 numbers – up by 5 percent (about $16 million) and near the numbers for 2018. Most of this increase is in Pistols & Revolvers and Ammunition. The noticeable negative is in archery equipment (bows, broadheads, and taxable attachments to the bow) that experienced a 9 percent decrease in collections (about $2 million). While this does not look like much, a 9 percent hit to the archery industry is huge. Interestingly, this hit to the archery industry does not appear to be COVID-19 related since the reductions in collections came in the first quarter of the fiscal year (October thru December). It is likely that this reduction had more to do with the excise tax leakages we have been seeing related to the large internet marketplace providers avoiding paying the taxes – more to come on that. My expectation is that we will continue to see strong collections for the Wildlife Restoration Account – if not related to COVID-19, then because of the upcoming elections.
Following is a closer look at the numbers.
The Sport Fish Restoration Account
The Trends:
Here are the comparisons of the collections for the first two quarters of FY 2019 and FY 2020.
table, th, td {
border: 1px solid #333;
border-collapse: collapse;
}
td {
padding: 5px;
}
| Trends Between Last and Current Fiscal Years | |||
| Product | FY 2019 (thru Qtr 2) | FY 2020 (thru Qtr 2) | % Change |
| Motorboat Fuel Tax | $107,181,000 | $106,506,000 | -1% |
| Small Engine Fuel Tax | $56,378,000 | $56,488,000 | 0% |
| Interest | $15,518,407 | $21,067,754 | 36% |
| Customs Duties | $32,769,281 | $27,477,680 | -16% |
| Fishing Equipment | $58,798,712 | $53,608,989 | -9% |
| Electronic Boat Motors | $2,952,740 | $2,746,800 | -7% |
| Fishing Tackle Boxes | $729,414 | $301,889 | -59% |
| Fishing Rods and Poles | $10,975,201 | $9,598,899 | -13% |
| Total Sportfish & Boating Restoration | $285,302,755 | $277,796,011 | -3% |
The Funding Sources:
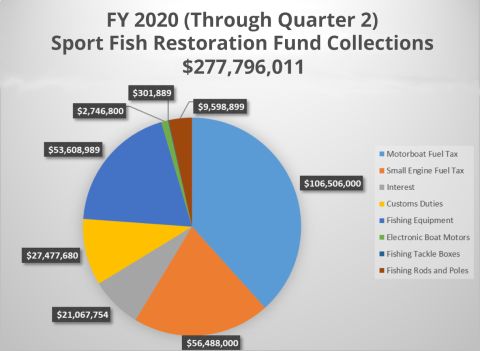
It is important to understand where these numbers come from, how they relate to past numbers and how the individual funding sources relate to the overall funding available. The following pie-chart provides a strong reference on the importance of funding sources that are not directly related to fishing equipment (motorboat and small engine fuel taxes; customs duties; interest) to the support of state agencies’ aquatic conservation efforts (76.1 percent of the total funding).
Wildlife Restoration Account
The Trends:
Here are the comparisons of the collections for the first two quarters of FY 2019 and FY 2020.
| Trends Between Last and Current Fiscal Years | |||
| Product | FY 2019 (thru Qtr 2) | FY 2020 (Qtr 2) | % Change |
| Pistols & Revolvers | $94,640,646 | $103,265,670 | 9% |
| Firearms | $95,257,589 | $95,297,329 | 0% |
| Shells & Cartridges | $92,023,327 | $101,349,622 | 10% |
| Archery Equipment | $22,275,457 | $20,164,527 | -9% |
| Arrow Shafts | $4,652,054 | $4,881,236 | 5% |
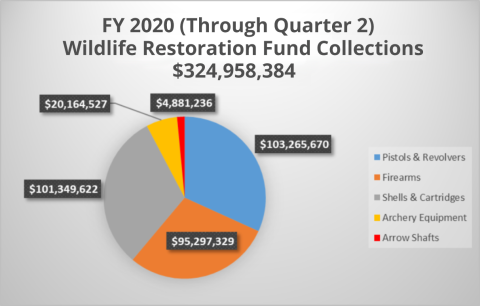
| Total Wildlife Restoration | $308,849,073 | $324,958,384 | 5% |
The Funding Sources:
An important piece of information that we must not overlook in this collection data is the source of the funds. Roughly speaking, less than 10 percent of the collections are coming from archery and around 30 percent each is coming from pistols, firearms, and ammunition. It is also interesting to note that pistols and ammunition are the biggest contributors – a strong message of support for recreational shooting ranges! Here is a pie chart that shows this a bit more dramatically:
Summary:
For the Wildlife Restoration Account, the overall numbers look promising, although the archery numbers provide cause for concern. I suspect we will continue to see volatile fluctuations through the upcoming election cycle. The Sport Fish Restoration Account numbers are troubling for different reasons – a lot hinges on the fuel tax collections over the next month or two.
The fluctuations we are seeing in both the Wildlife and Sportfish Restoration accounts – which represent the core of the American System of Conservation Funding – are problematic for state fish and wildlife agencies. These agencies are charged with managing our fish and wildlife resources, which requires a reliable long-term funding source.