Outdoor News Bulletin
2017 Census of Agriculture Early Results Available
Farmland down, women in agriculture up, no-till becomes most common tillage practice
Every five years the USDA conducts a census of agriculture to provide a snapshot of activity and trends in the industry. While the census attempts to get every producer to participate, the response rate for the 2017 Census of Agriculture was 71.8 percent. Early results are being reported with much more information to come in future months. The 2017 Census shows an overall decline in farmland and the number of farms, provides information about the demographics of producers, documents crop and commodity trends, and evaluates participation in conservation programs.
There are 2.26 billion acres in the United States. Between 2012 and 2017, the number of acres of land in farms fell by 14.3 million acres or 1.6 percent to 900 million acres. That means that in 2017, 40 percent of land in the U.S. was producing food and fiber for U.S. and non-U.S. citizens alike. This is the lowest share of U.S. land dedicated to agricultural use since the 1910 Census of Agriculture. As a note, 1950 was the year with the highest share of land dedicated to agricultural use with 51.1 percent of land in farms. (In 1935, the Census reported that 55.4 percent of land was dedicated to agriculture, but this data point is excluded because it occurred before the United States was remeasured in 1940.)
USDA further breaks down ag land into four different uses: cropland, woodland, pastureland and other including farmsteads, homes, buildings, livestock facilities, ponds, roads, wasteland, etc. Here we see interesting shifts. Between 2012 and 2017, acreage in cropland was the only segment to increase, up 6.7 million acres. The largest decline was in pastureland/rangeland, which was down 14.5 million acres. Acreage in woodland and other ag uses also declined, by 3.9 million acres and 2.5 million acres, respectively.
The 2017 Census of Agriculture questionnaire substantially revised the demographic data collected in order to better capture the contributions of all persons involved in farm operations and agricultural production. The revised questions, which identified a producer as someone involved in making decisions for the farm, led to more people identifying as producers. In 2017, the total number of U.S. producers was 3.4 million, a 6.9 percent increase over 2012, as more farms reported multiple individuals involved in farm decision making. In 2017, the majority of farms (54 percent) reported more than one person as producer. In 2012, the majority (56 percent of farms) identified only one producer. While the number of male producers declined 1.7 percent, the number of female producers increased nearly 27 percent, underscoring the effectiveness of the attempt to better represent all people involved in farm decision making.
The total number of farms declined between 2012 and 2017, from 2.11 to 2.04 million. All categories of mid-sized farms declined. The largest farms (sales of $5 million or more) accounted for fewer than 1 percent of all farms but 35 percent of all sales. Small farms (sales of $50,000 or less) accounted for 76 percent of the farms and 3 percent of the sales.
In 2017, U.S. farms and ranches produced $388.5 billion in agricultural products, down from $394.6 billion in 2012. Crop and livestock commodities each account for half of the total. In 2012, only the second time in census history, the value of crop sales exceeded livestock sales; 2017 is a return to longer-term trends.
Cattle and calves was the top ranked commodity, with $77.2 billion in sales. Texas was the top state in cattle and calf sales, accounting for 16 percent of the U.S. total. Iowa was the top state in corn sales, accounting for 17 percent of the U.S. total. Georgia led the nation in poultry and egg sales while Illinois topped all states in soybean sales. California was the top state in milk sales with 18 percent of the U.S. total. These top five commodities accounted for $255 billion in sales, 66 percent of U.S. total agriculture sales.
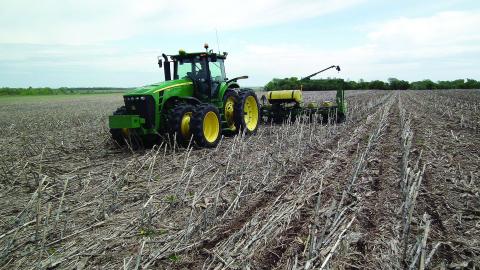
No-till practices are now the most common tillage technique on cropland in the United States, after an 8 percent increase in 2017 as compared to 2012. Following no-till are conservation tillage techniques, increasing by 28 percent. Finally, conventional tillage practices were utilized on nearly 25 percent fewer acres in 2017.
Beyond tillage techniques, the 2017 Census highlights that farmers are embracing a wide variety of environmental practices. Farmers increased the number of acres of cropland planted to a cover crop by nearly 50 percent as compared to 2012. Further, the number of operations with renewable energy devices increased by 132 percent. This huge increase was driven by large increases in the number of operations with solar panels, wind turbines, methane digesters, and geo-exchange systems.
In 2017, 75 percent of U.S. farms had internet access, up from 70 percent in 2012. Rates are higher in western and northern states.